Thermal Colors: Leave the Past Behind and See the World in a Whole New Light
Discover the amazing colors and thermal palettes of your optical devices. Understanding the various thermal colors is essential for optimizing performance on the field. Learn how to use them to get the best results with this comprehensive guide.

Have you ever seen a thermal image and wondered what all of those different colors mean? Or maybe you use thermal imaging every day and would like to learn more about how to interpret the data.
If so, then you're in luck! In this blog post, we will explore thermal colors, the science behind them, and their many applications in different fields. We'll also discuss the various thermal color palettes, explaining how to interpret each color in an image.
Plus, we'll talk about how thermal imaging can be utilized in different industries. So no matter if you're a pro with experience or just someone curious about thermal imaging, this post is for you! Let's get started!
The Physics behind Thermal Colors
To truly understand thermal colors, it's important to understand the physics behind them.
The Electromagnetic Spectrum
The electromagnetic spectrum is a way of classifying different types of electromagnetic radiation based on their wavelength and frequency. This includes radio waves, microwaves, infrared radiation, visible light, ultraviolet radiation, X-rays, and gamma rays. Each type of radiation has a different wavelength and frequency, which determines its properties and how it interacts with matter.
How Thermal Radiation fits into the Spectrum
Thermal radiation, also known as infrared radiation, is a type of electromagnetic radiation that falls within the infrared portion of the spectrum. This means it has a longer wavelength and a lower frequency than visible light, but a shorter wavelength and higher frequency than microwaves. The wavelength of thermal radiation ranges from about 780 nanometers (nm) to 1 millimeter (mm).
How Thermal Devices detect and display Thermal Colors
Thermal devices (cameras, scopes, monoculars, binoculars, etc) are specifically designed to detect and display thermal radiation. These devices use a special type of sensor called a microbolometer to detect infrared radiation.
The microbolometer measures the intensity of the radiation it detects and converts it into an electrical signal. This signal is then processed by the built-in electronics and turned into a visible image. The visible image created by the thermal camera is a representation of the temperature of the objects in the scene.
The color palette used in thermal imaging is called a "false color palette". This means that the colors used in the image do not necessarily correspond to the actual colors of the objects being imaged. Instead, different colors are assigned to different temperature ranges.
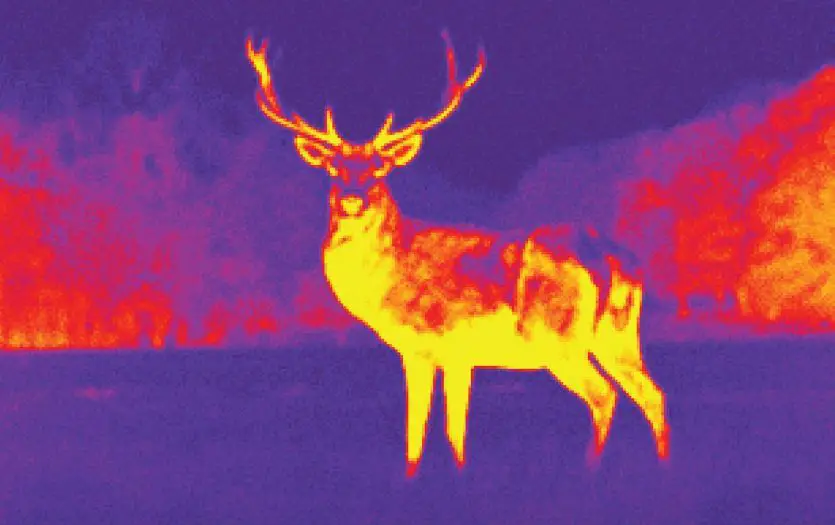
For example, in a typical thermal image, cool temperatures are typically represented by blues and greens, while warmer temperatures are represented by yellows, oranges, and reds.
Check out this video to understand thermal color palette:
Understanding Thermal Color Palettes
One of the most important aspects of interpreting thermal images is understanding the color palette used to represent the temperature data. Different thermal devices and software use different color palettes, and it's essential to understand how to interpret the colors in order to extract meaningful information from the images.
Different Types of Thermal Color Palettes
There are several different thermal color palettes in use today, each with its own unique strengths and weaknesses. Some of the most common thermal color palettes include:
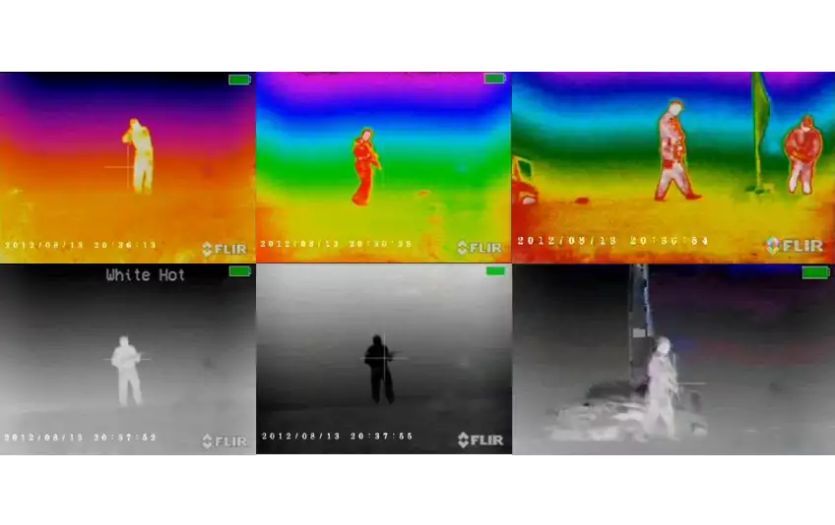
- Ironbow: This palette is commonly used in industrial applications and is known for its high contrast and easy-to-see temperature gradations.
- Rainbow: This palette is often used in scientific research and is known for its natural-looking colors and smooth temperature gradations.
- Grayscale: This palette is often used in military and security applications and is known for its ability to show fine temperature details.
How to Interpret Different Colors in Thermal Images
The key to interpreting thermal images is understanding the relationship between color and temperature. In most thermal color palettes, cool temperatures are typically represented by blues and greens, while warmer temperatures are represented by yellows, oranges, and reds.
However, it's important to keep in mind that different color palettes may use different color assignments for different temperature ranges. For example, in the Ironbow palette, cool temperatures may be represented by blues, while in the Rainbow palette, cool temperatures may be represented by greens.
Commonly Used Thermal Color Palettes in Different Industries
Different industries and applications have different requirements for thermal imaging, and as a result, different color palettes are often used. Some of the most common thermal color palettes used in different industries include:
- Industrial: Ironbow and Grayscale are commonly used in industrial applications to help identify hot spots and potential issues in equipment.
- Scientific Research: Rainbow is often used in scientific research to study animal behavior and monitor environmental changes.
- Military and Security: Grayscale is commonly used in military and security applications to provide high-resolution images in low-light conditions.
Final Thoughts
Understanding the science behind thermal colors can greatly enhance your understanding and ability to use thermal imaging. Instead of just seeing black and white, thermal colors offer a range of shades that can provide valuable information.
By gaining a deeper understanding of how these colors work, you can start to see the world in a new and exciting way. And when you're interested in incorporating thermal imaging into your hunting or other activities, be sure to check out our articles on the top thermal devices for hunters for the best options.